Locate Distributive Energy Opportunities Using Analytics
According to the Solar Energy Industries Association Today, more than 750,000 homes and businesses in the United States use solar power systems, with a majority found in Arizona, California, Colorado, Hawaii, Nevada and New Mexico. That means there are now hundreds of thousands of generation points on a system originally designed for just hundreds of centralized power stations.
Balancing supply and demand in real time was complex enough with just legacy generation like coal and hydro. Now, there is an evolution toward a more-dynamic distribution grid supporting distributed energy sources (DERs) such as solar power, energy storage, demand response programs, electrified transportation and more. Where there was once a one-way flow of energy, these new technologies generate bi-directional flows of power, communications and data.
Successfully integrating these new, bi-directional resources into a distribution grid takes knowledge, innovation, teamwork — and money. Further, it requires a new, data-driven analytics approach to operating and planning the distribution grid.
The Challenges of DERs
DER technologies are reshaping the demand curve. Midday can now be peak solar generation, while overnight hours are prime vehicle charging time. DERs also generate a bi-directional flow between the utility and its customers. Smart thermostats, smart meters and load-control devices communicate with and receive commands from utility head-end systems. These devices provide much more granular insight into and control over energy consumption. However, this bi-directional flow of data creates a challenge for utilities. Correlating, analyzing, visualizing and acting on this constant flow of data quickly overwhelms human operators and the legacy tools they have for working with data.
Utilities have begun to embrace new data analytics strategies to better manage the sheer amount of ever-changing variables in this new-energy environment. Analytics give utilities the ability to pinpoint the what, where, when and why of shifting loads and voltages on the distribution grid, saving them time and money while avoiding costly service interruptions in real time.
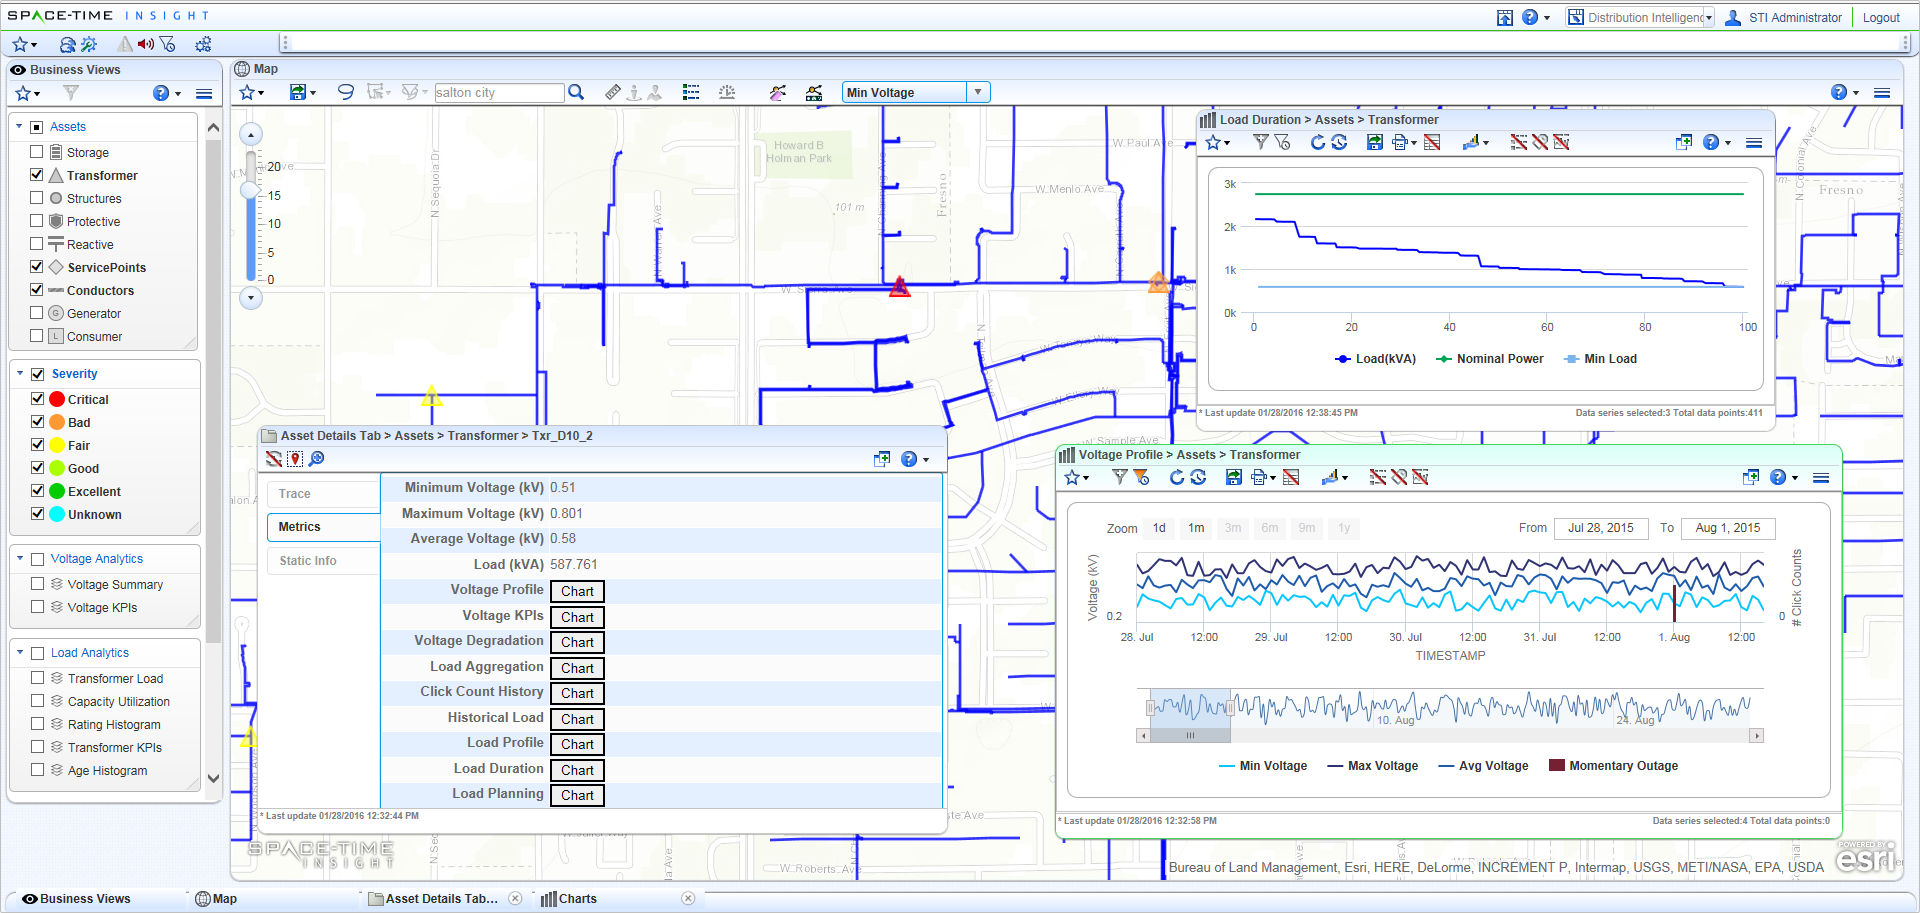
Using Feeder Analytics
The first step to integrating DERs into the distribution grid is to understand where a system can benefit from new energy resources, and where it’s vulnerable to them. This requires feeder analytics that correlate operational and enterprise data from across an organization, along with external data sources such as weather forecasts, demographics, building permits, and even traffic and social media data.
Correlating all the relevant data for one feeder might be humanly possible, but there are dozens or hundreds of feeders to analyze. Utilities don’t want to correlate data by hand into individual spreadsheets to do the calculations necessary to find opportunities. That would require months or maybe years.
Feeder analytics pinpoint portions of the distribution grid where solar power and energy storage are beneficial. Specifically, utilities are looking for portions with high-peak loads and low-to-moderate penetrations of solar power. Adding solar power and storage to those areas will allow the utility to serve additional load without the need for expensive capital upgrades to the distribution network. Those areas also could be targeted for energy efficiency and demand response programs to bring down the peak load.
By targeting portions of the distribution grid with high-peak load, utilities can postpone time- and capital-intensive upgrades to their distribution infrastructure. This keeps the current infrastructure functioning longer, preserving capital, delivering higher-quality power quicker, and reducing their carbon output.
Pinpointing Problems
Feeder analytics also pinpoint portions of the distribution grid where solar power is having a detrimental effect. Too much solar generation pushing power back onto the feeder causes spikes in voltage that lead to damaged electrical equipment and eventually power outages. By correlating solar conditions, the location of solar power installations, and the times and places where voltage spikes occur, utilities will find that the feeders that are connected to more solar power installations than they can currently support.
Conversely, neighborhoods with high concentrations of electric vehicles can experience drops in voltage when all the cars are charging simultaneously. This is especially true at nighttime, when electricity prices are low and power flows are reduced to match historical usage patterns.
In areas experiencing voltage volatility, adjustments to capacitors and voltage regulators help smooth fluctuations. Using energy storage also can absorb energy during times of over-generation. Some utilities are even using demand response programs that switch on residential water heaters during times of over-generation to absorb excess energy.
For example, our customer E.ON uses analytics, specifically our Smart Meter and Demand Response Intelligence solution, to evaluate energy consumption patterns across its service area to detect anomalies in meter data and failing meters on a monthly, daily and hourly basis.
E.ON’s system uses machine learning to continually improve how it manages the difference between production and consumption, minimizing service interruptions for its customers.
Raise Funds While Lowering Risk
To create the capital efficiency needed to direct investments towards supporting distributed energy resources, utilities first need to understand the risks inherent in their current asset fleet. Once utility professionals know the true asset risks in the grid, they can begin optimizing performance.
In asset investment planning, risk is the likelihood of asset failure, combined with the consequence should failure occur. Each asset has its own unique risk profile. Factors such as age, location, usage, maintenance and the relationship to other assets all contribute to an asset’s risk profile.
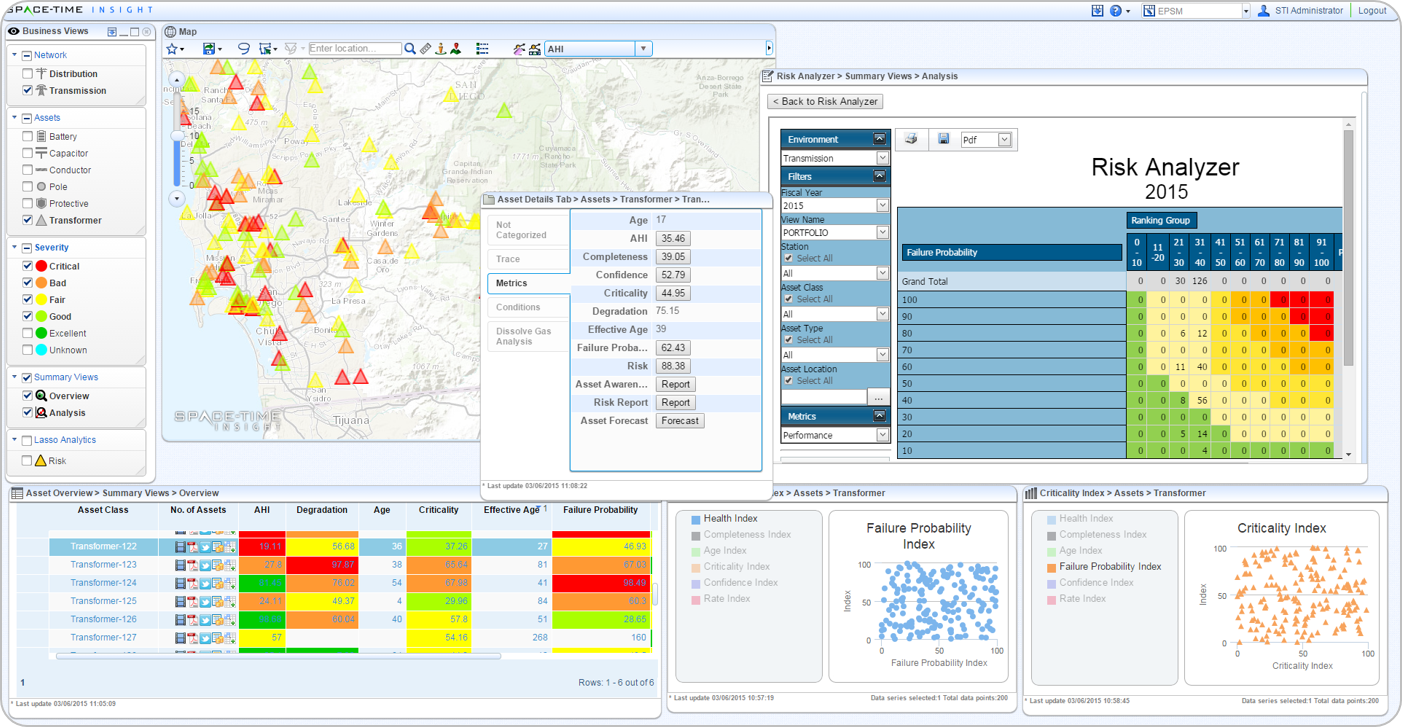
For example, consider two, identical power transformers installed on the same day. Based just on age, make and model, they should have the same risk level. But if one transformer spends its life in a shady and protected spot serving a relatively light load in a residential neighborhood, it likely will have a much lower probability of failure than its twin toiling way in an exposed, hot area serving a fast-growing commercial district. In addition, if the residential power transformer should fail, the consequences of a power outage likely are less than the losses if the commercial district loses power.
Discovering the level of risk in assets allows utilities to be more discriminating in how they invest their money, time and resources. More-informed asset operations and investment can give utilities the confidence and the funds to start investing in supporting these new energy resources.
Using Situational Intelligence
Knowing where and when there is too much or too little energy in a distribution network is hard enough to calculate when everything is one-directional. As distribution becomes bi-directional flows of energy and communication, finding those points of imbalance becomes impossible without the aid of analytics.
Situational intelligence is an innovative type of analytics that excels at complex, what-where-when problems on a network, such as balance power on a bi-directional distribution grid.
Situational intelligence correlates multiple sources of disparate data and analyzes them across spatial, temporal and network dimensions simultaneously. The resulting analytics reveal the what, where, when, why and how of any asset or event related to the network. This level of analytics can’t be done by hand using spreadsheets or standard business intelligence tools. Increasingly, it’s the level of analytics needed to plan and operate the new, bi-directional distribution grid.
Vendors such as Space-Time Insight are bringing situational intelligence applications to utilities to solve the challenges of the bi-directional distribution network. Learn more about situational intelligence by reading the Situational Intelligence blog at www.situationalintelligence.net.
Planning for the Future with Predictive Analytics
The power of analytics lies in prediction; once you can quantify something, you can predict it. Predictive analytics bring together multiple variables to model how a distribution system will age, change and grow over the coming years.
Predictive feeder analytics that incorporate load growth, projected and targeted DER penetration, peak load reductions from demand response and energy efficiency, long-term weather patterns, shifting demographics, economic trends and other data, can provide detailed insight into a utility’s future distribution requirements. Each of these variables can be separately weighted to further refine the output of a predictive model.
Utilities can use predictive asset analytics to build a specific map of how to maintain, refurbish and replace aging assets in support of DER technologies. Predictive asset analytics provides a year-by-year plan of which assets to invest in, and how, to optimize spending and risk levels.
Of course, predictions are only as good as the data. Again, analytics provides useful guidance and insight. The analytics can be analyzed by evaluating the accuracy, completeness, relevance and recency of the data. Pinpointing shortcomings in these data quality characteristics helps in two ways: One, it increases the confidence in predictions. Two, it narrows the scope of any data quality projects that a utility might want to undertake to improve the accuracy of its predictions. Fixing just one aspect of a subset of the data is much more manageable than trying to somehow clean all of the data.
Used hand-in-hand, feeder and asset analytics create a data-driven blueprint for how utilities can operate the grid today and evolve the grid over time to optimize risk, spending and DER integration.
